Port scanning from the browser
While messing around with the stuff from my previous blogpost I noticed some interesting browser behavior.
The W3 Cross Origin Resource Sharing standard dictates, that when a website attempts to fetch an URL and fails the CORS check, the error should be indistinguishable from a network failure.
Browsers of course implement this — unfortunately, a browser can only asses whether a request failed the CORS check after opening the connection and finishing the HTTP request/response roundtrip. Depending on the target service, this means that there can be significat difference in execution time for these requests.
For example, I can easily figure out if you have an OpenWRT router running the LuCI
webinterface just by measuring the time to failure of a request headed for
http://192.168.1.1/cgi-bin/luci (and comparing this to some negative “baseline” case).
var x = new XMLHttpRequest();
var tStart = 0;
x.onreadystatechange = function() {
	if (x.readyState === XMLHttpRequest.OPENED) {
		tStart = performance.now();
	} else if (x.readyState === XMLHttpRequest.DONE) {
		var tDelta = performance.now() - tStart;
	}
}
x.open("GET", "http://127.0.0.1:2222", true);
x.send();
You can play with the following demo:
?
For my TP-Link TL-WR1043ND this yields about 171 ms for the positive case and 43 ms for the negative case.
Of course this is child’s play — SOHO routers are really slow devices and the timing differences are large.
This method is sensitive enough to figure out whether there is a TCP service running on localhost. This makes sense, as the browser still needs to perform at least one “network” roundtrip for these cases.
The demo below demonstrates this for OpenSSH running on port 2222.
?
With Chromium on Linux I am getting around 6.5 ms for OpenSSH and 1.6 ms for the negative port.
This technique is somewhat restricted in modern browsers as they straight out refuse to connect to ports on the “unsafe” list.
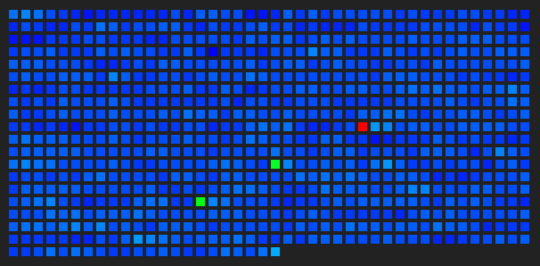
The final demo below scans around 800 “interesting” ports (whatever nmap does by default) on 127.0.0.1. The pixel color is based on sliding window median of the measured time-to-failure values. The code is fairly hacky, so don’t expect any miracles.
Edit: Firefox limits
resolution of performance.now() to 2 ms, which seems insufficient for this demo
to work. It might still be possible to get it working by acquiring more samples and
performing some better processing to remove the quantization noise.
-
On my box, the result after a few dozen rounds looks like this. The three bright pixels are OpenSSH (2222), Jekyll (4000) and TensorBoard (6006) respectively.
